How to use the Scenario Explorer?
- 1. Choose scenarios, regions and targeted variables: You can select scenarios from a range of energy scenarios created in the iDesignRES project, covering different regions and policy pathways. Then, you can also select the regions and countries for which you are interested to see the data as well as the specific variables you are interested in (e.g., final energy, capacity, emissions, etc).
-
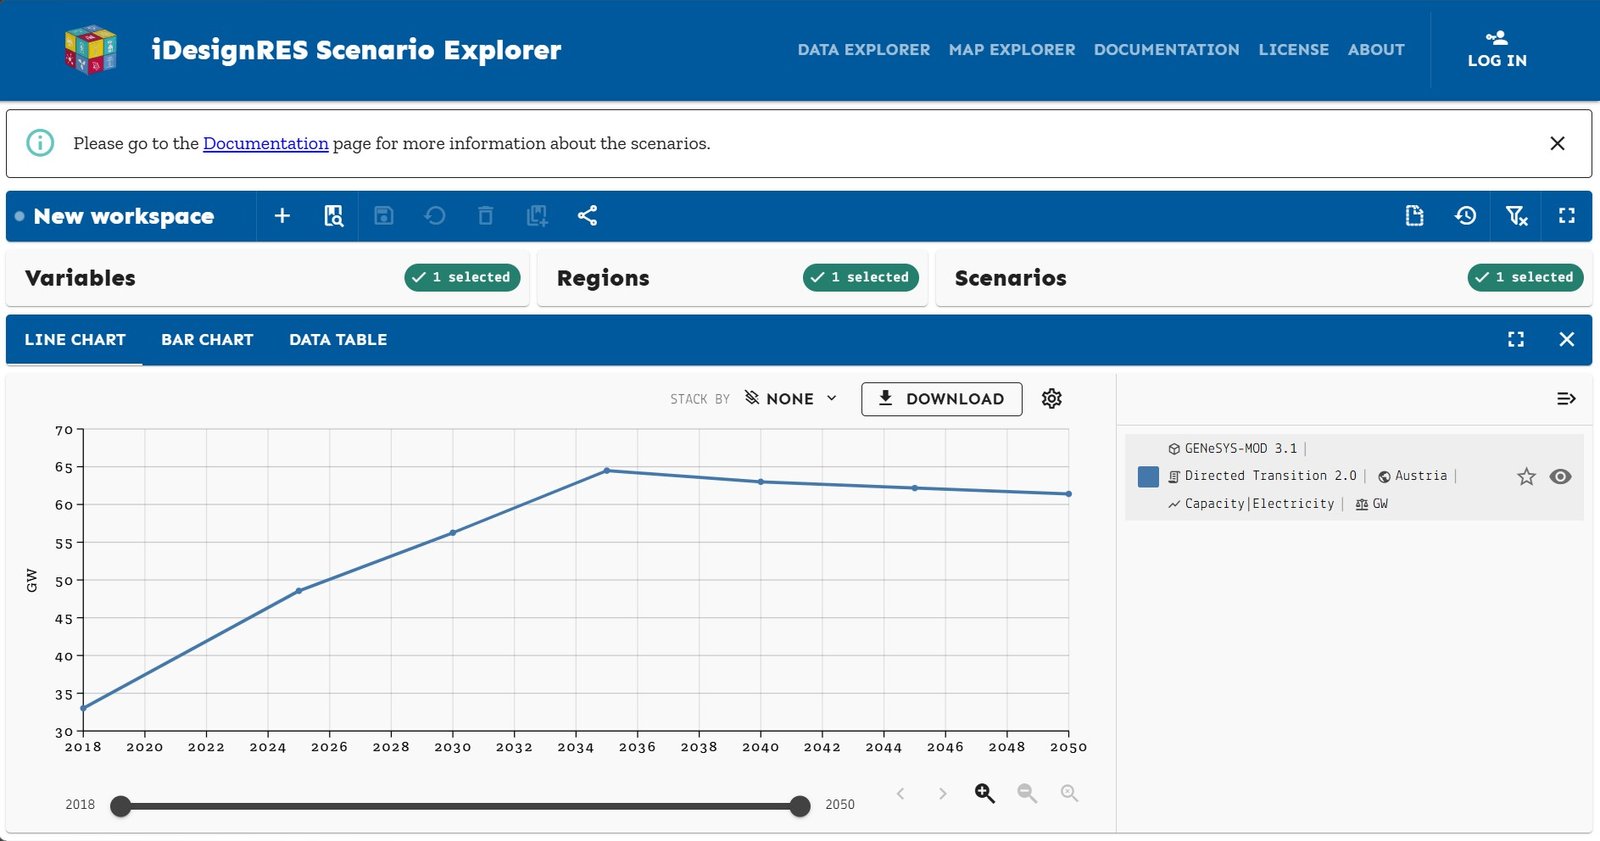
2. Explore results:
View interactive graphs showing energy supply, demand, emissions, and more. You can zoom in on different years, regions, or sectors and select line or bar chart. A Map Explorer is also available:
- A multi-carrier location, investment, and demand planning tool leveraging PRIMES model expertise.
- A detailed multi-carrier NUTS Level2 operational simulation model disaggregating JRC-EU-TIMES model.
- 3. Compare futures: Overlay multiple scenarios to see how different choices could affect Europe's energy system.
- 4. Access the data: Download or export the data behind the scenarios for your own analysis.